

Calibration Blocks for Baseline Accuracy H2 Series


Calibration Blocks for Baseline Accuracy H2 Series
- Made to order — 3D printed after you buy
- Free shipping on orders over $25
- Quality checked before it ships
- Questions? Contact us · Returns
TL;DR
| Test Phase | Measurements | Avg (mm) | Deviation from 50 mm | Perceived Shrinkage in % | Consistency |
|---|---|---|---|---|---|
| Before Vision Encoder | mix of 49.6x values | 49.680 | −0.320 mm | 0.64% | lower |
| After Vision Encoder | 8× 49.72, 2× 49.74 | 49.724 | −0.276 mm | 0.55% | high (0.02 mm spread) |
Test purpose and setup
Here’s a simple but useful little project for anyone who wants to check the baseline dimensional accuracy of their Bambu Lab H2 series printer – completely without the Vision Encoder (at least for now).
Before deciding whether I actually need the Vision Encoder upgrade, I wanted to test how well my H2D performs straight out of the box. The printer is already impressively precise, but I wanted to approach this in a slightly more scientific way.
So I designed a clean set of 50×50 mm calibration blocks. One corner is rounded to hide the layer seam so it won’t interfere with measurements. When you're trying to detect deviations as small as 0.1 mm, even a seam can throw off your caliper readings. With the rounded corner, both X and Y axes provide perfectly straight lines for accurate measurement.
To get a good spread across the full build plate, the model is printed five times:
- center
- rear left
- rear right
- front left
- front right
This layout should give a solid first impression of how consistent the printer is across its entire printing area.
After printing, I’ll measure all five blocks and see if any of them deviate from the expected 50×50 mm.
If I do find variations, I’ll order the Vision Encoder and repeat the experiment to see how much the calibration improves the results.
Feel free to use these blocks for your own accuracy tests — and share your findings if you want!
Baseline-Test
After printing and measuring all five calibration blocks, I ended up with an average dimension of 49.68 × 49.68 mm instead of the intended 50 × 50 mm. This would correspond to a shrinkage of about 0.32 mm (≈0.64%). PETG typically shows a shrinkage somewhere in the 0.2–0.6% range, so my result is slightly above the expected value but still within a reasonable range for an initial baseline test. This gives me a good starting point, and I plan to repeat the experiment after using the Vision Encoder to see how / if the dimensional accuracy changes.
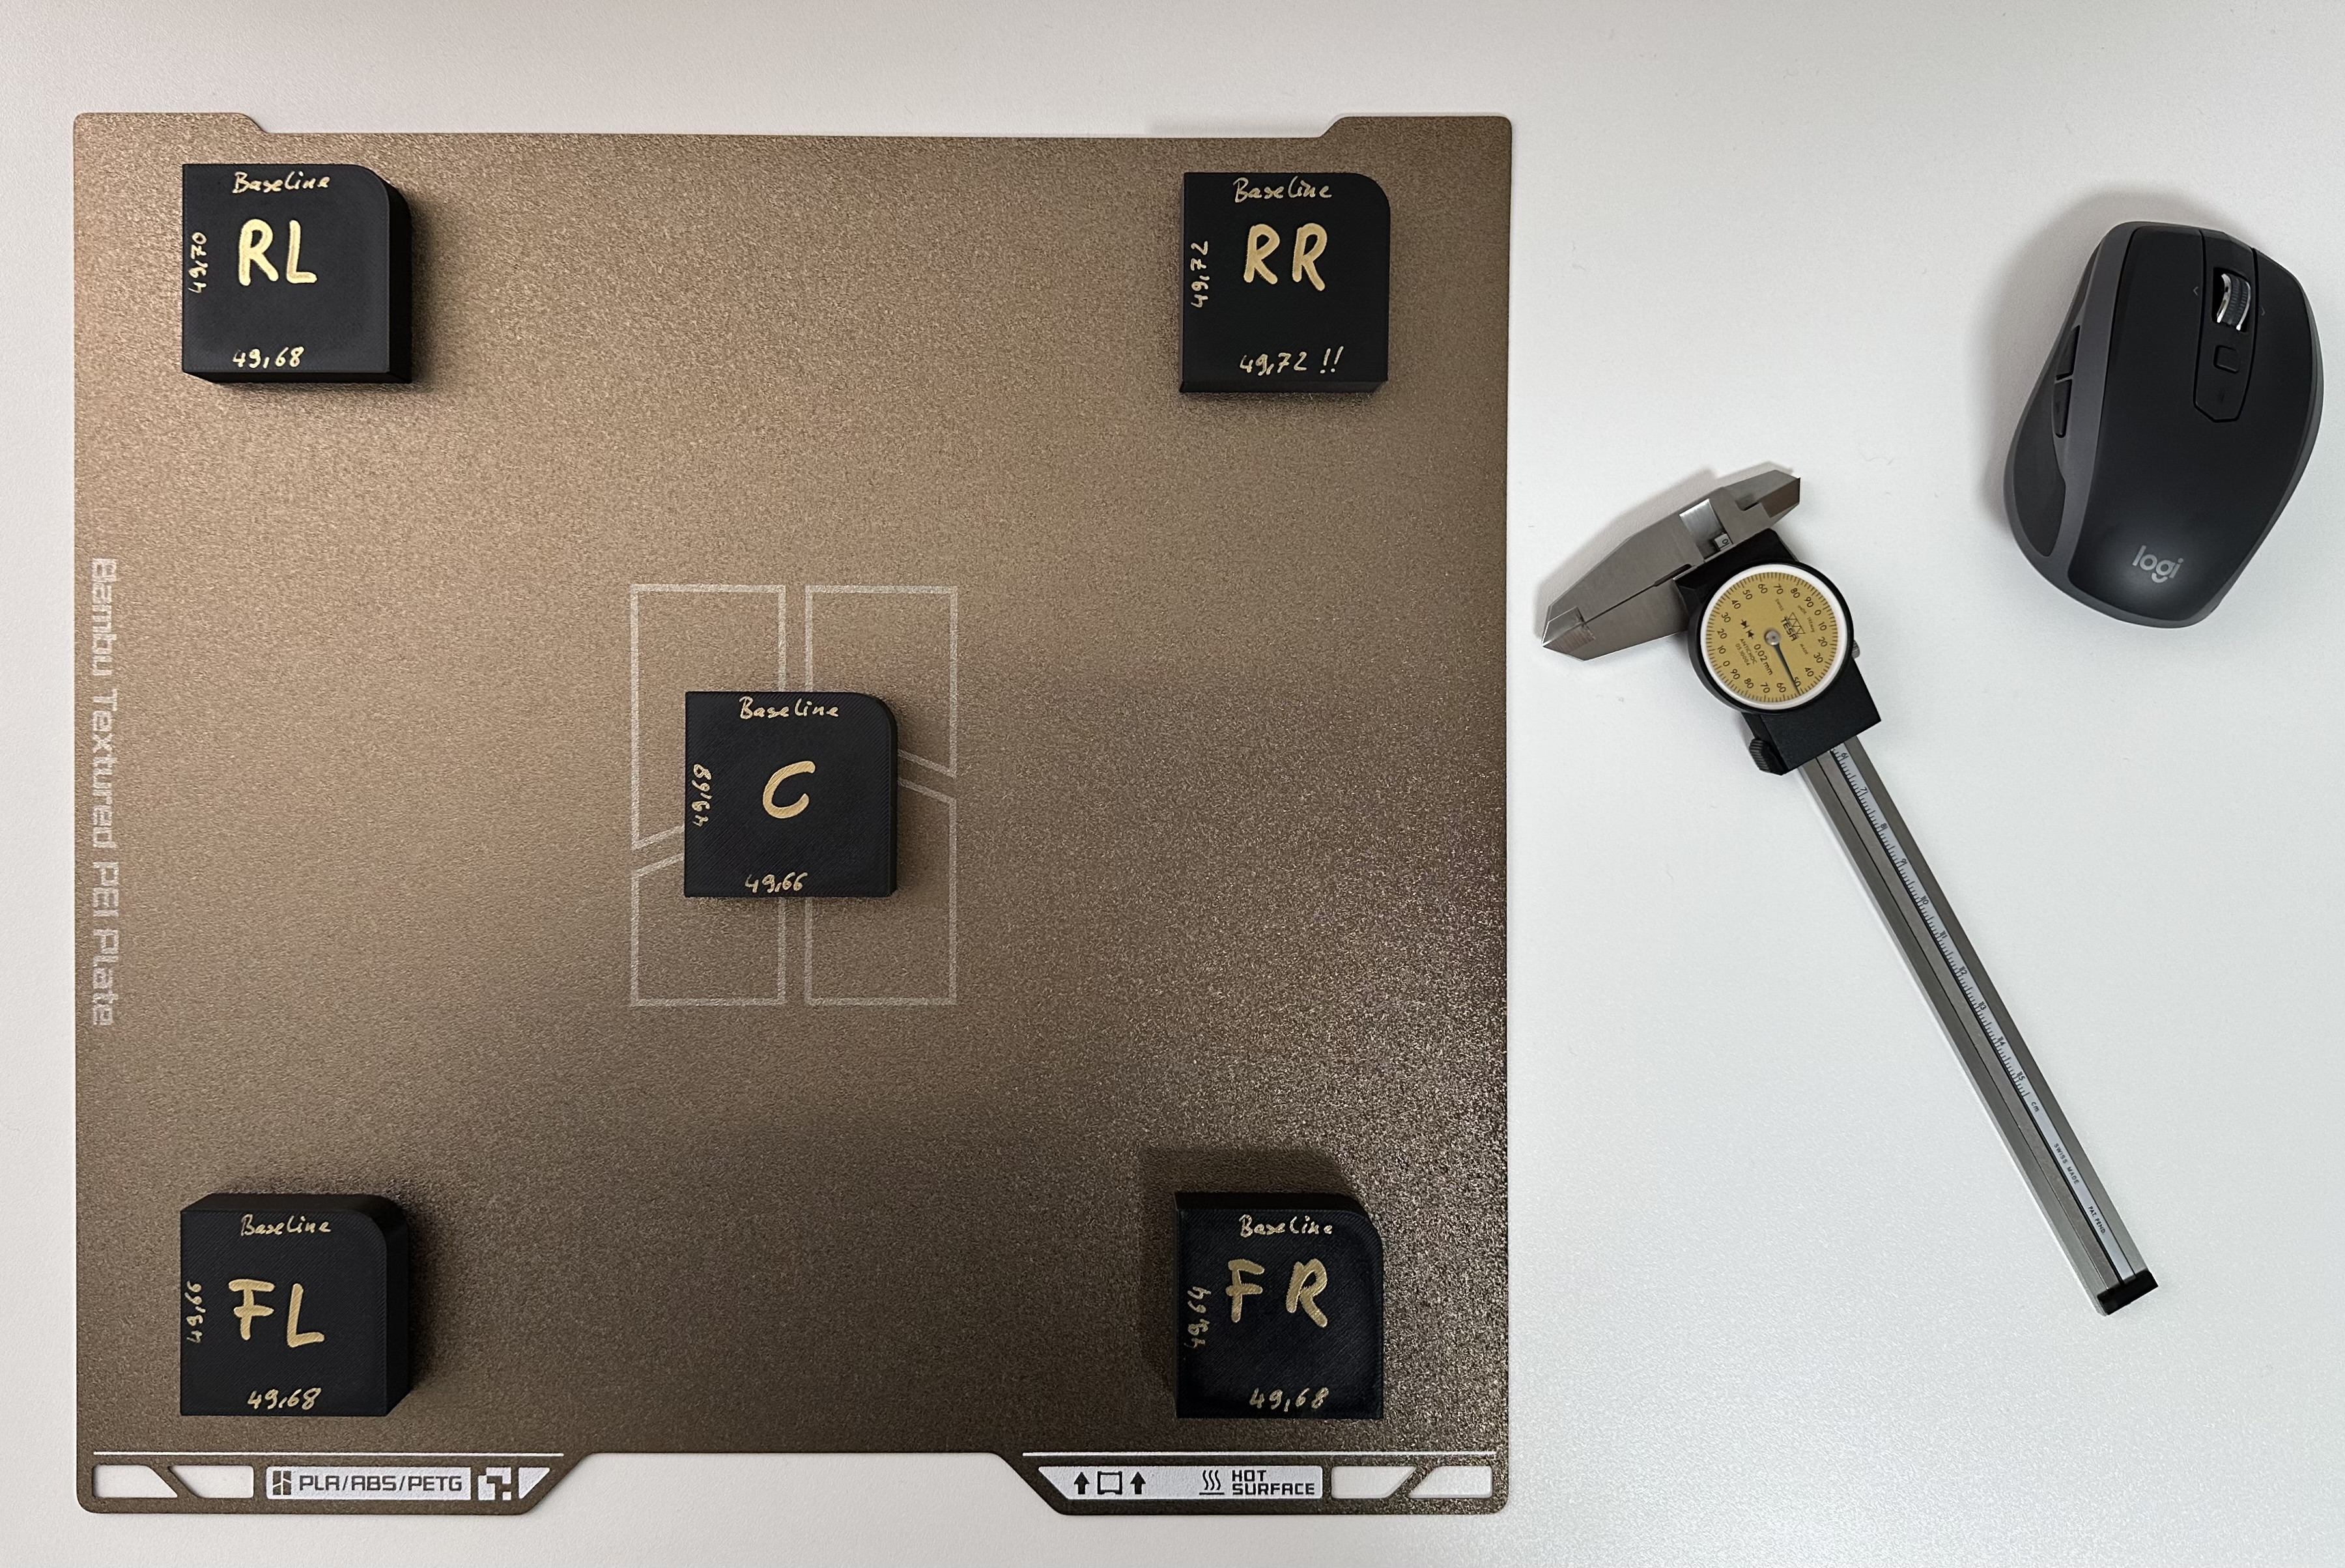
I’ll now order the Vision Encoder and repeat the test to see if the measurements improve after calibration and a new set of prints.
Vision-Encoded-Test
After installing the Vision Encoder and completing the calibration process, I repeated the baseline accuracy test with five new 50×50 mm calibration blocks.
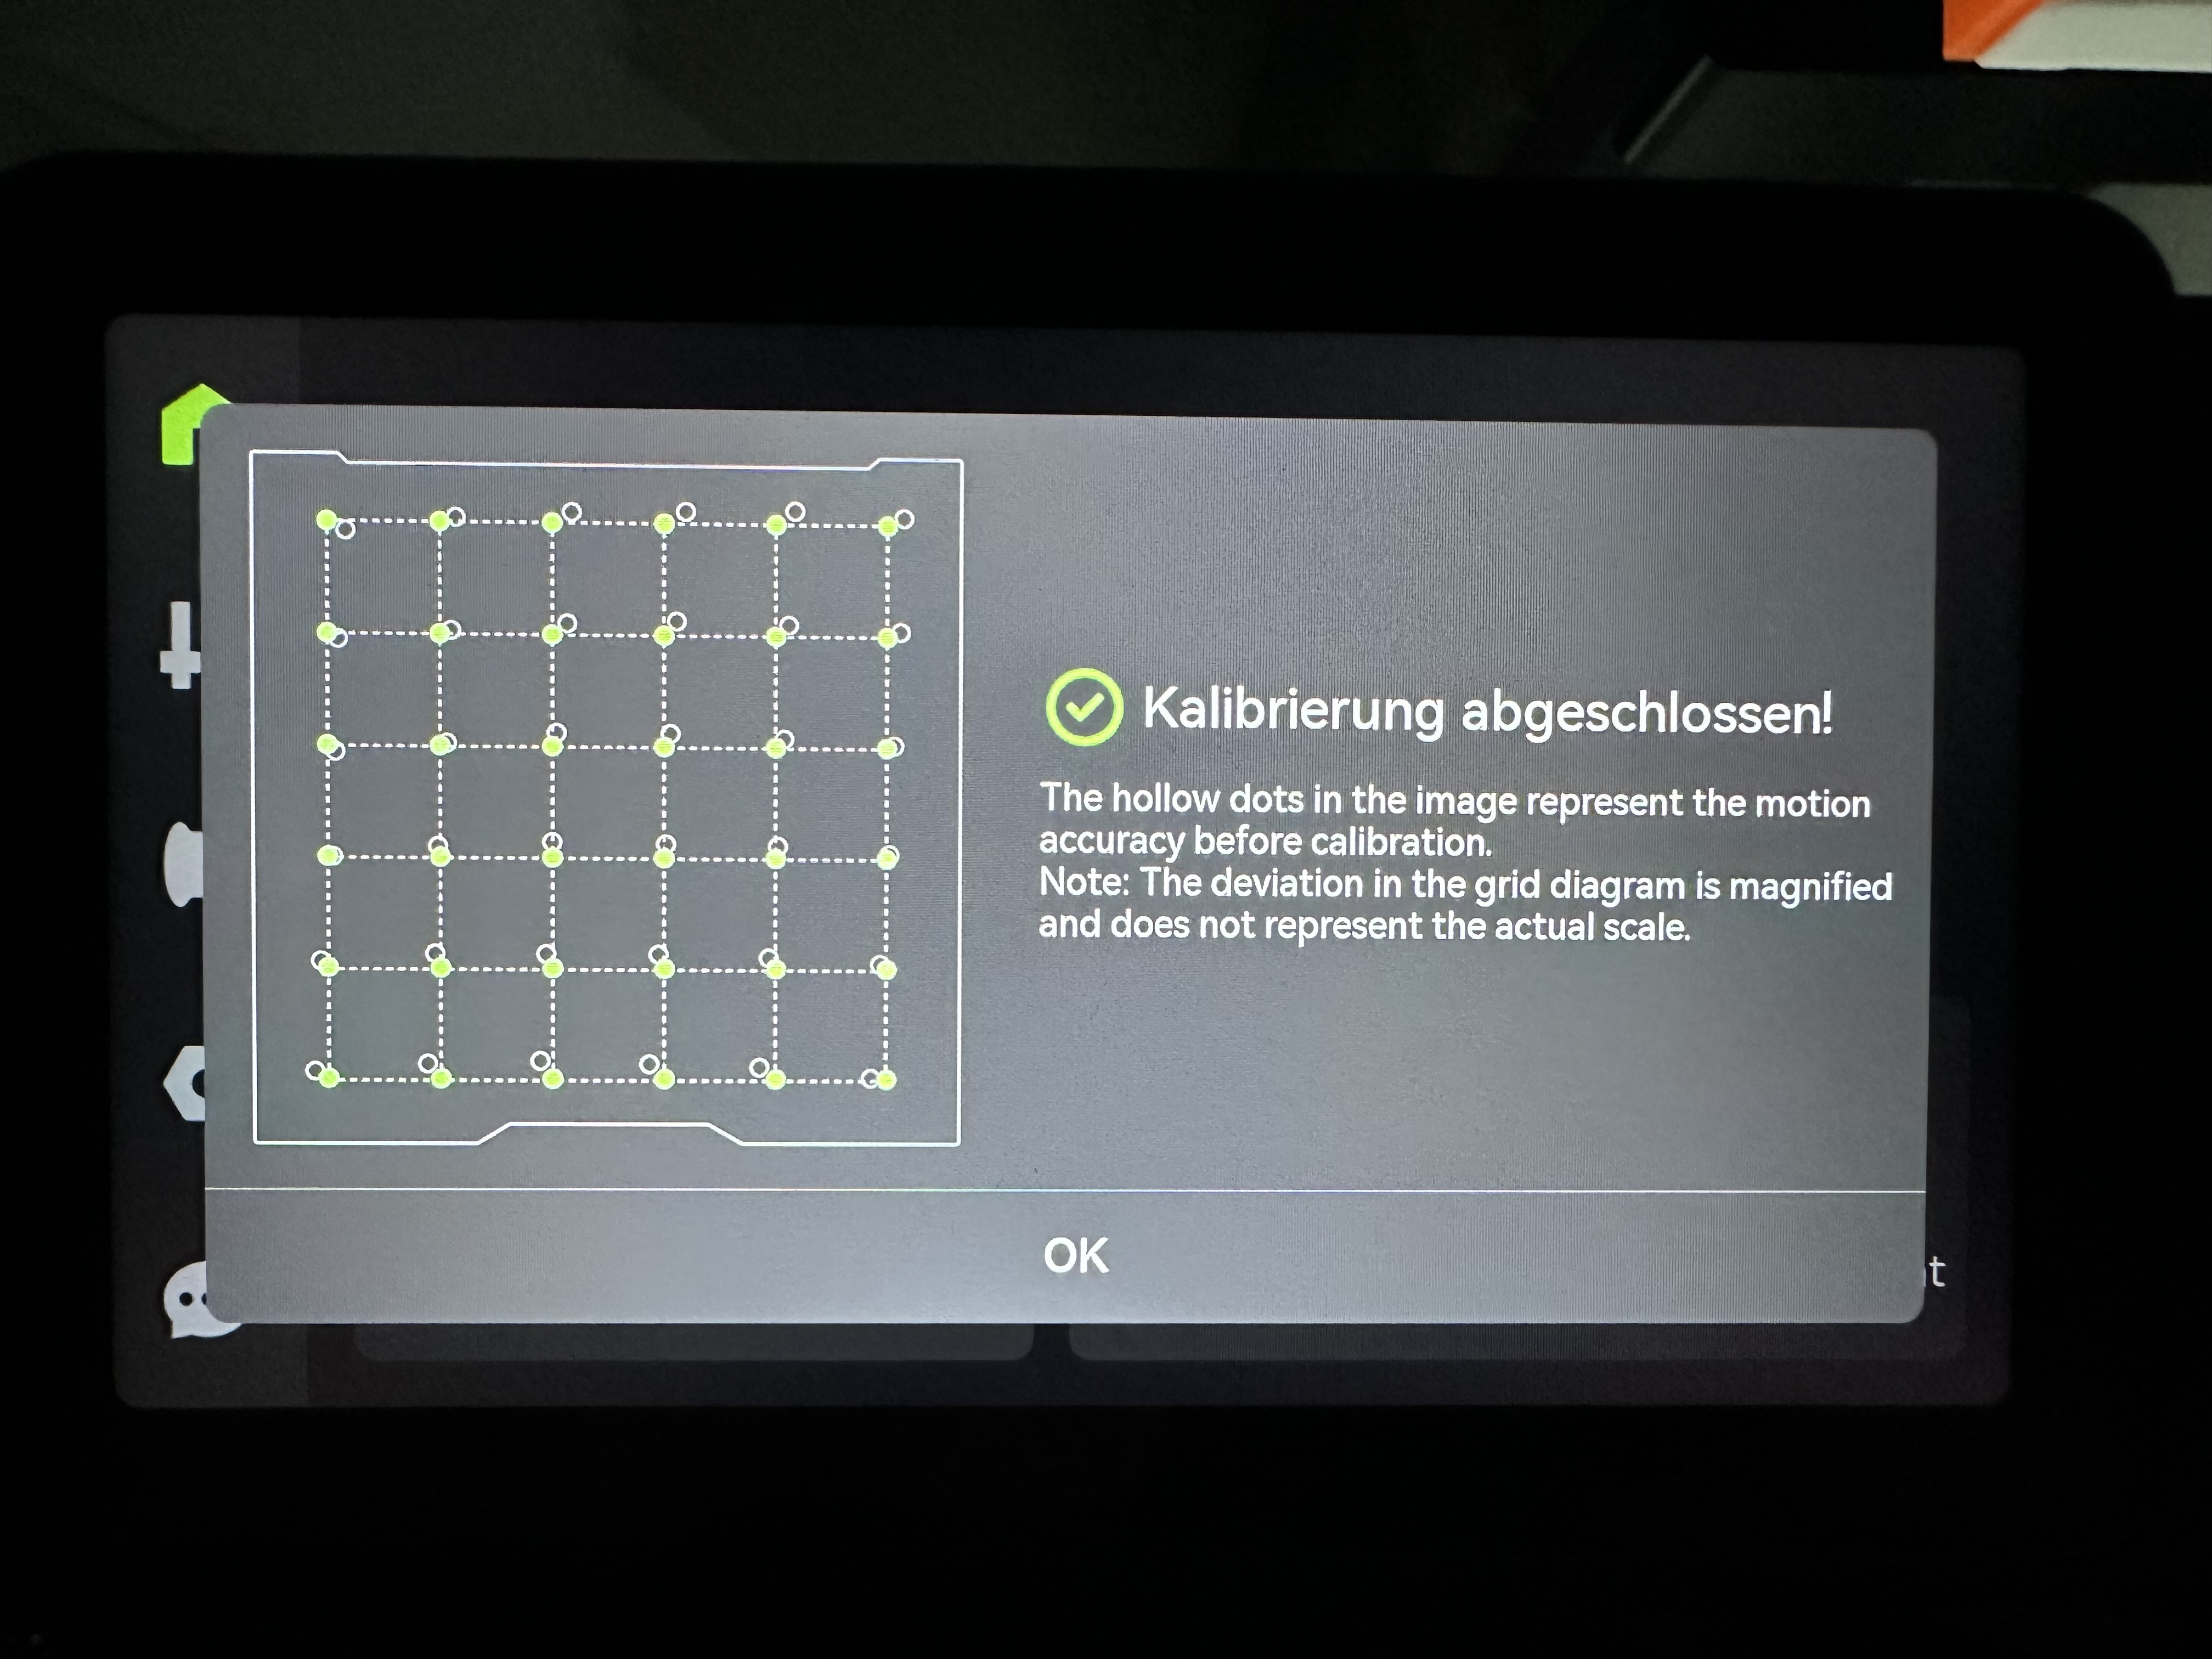
This time the results were much more consistent: 8 blocks measured 49.72 × 49.72 mm and 2 blocks measured 49.74 × 49.74 mm. That’s a total variation of only 0.02 mm, which is a clear improvement compared to the first test.
In particular, the calibration blocks are now consistent across both the X and Y axes:
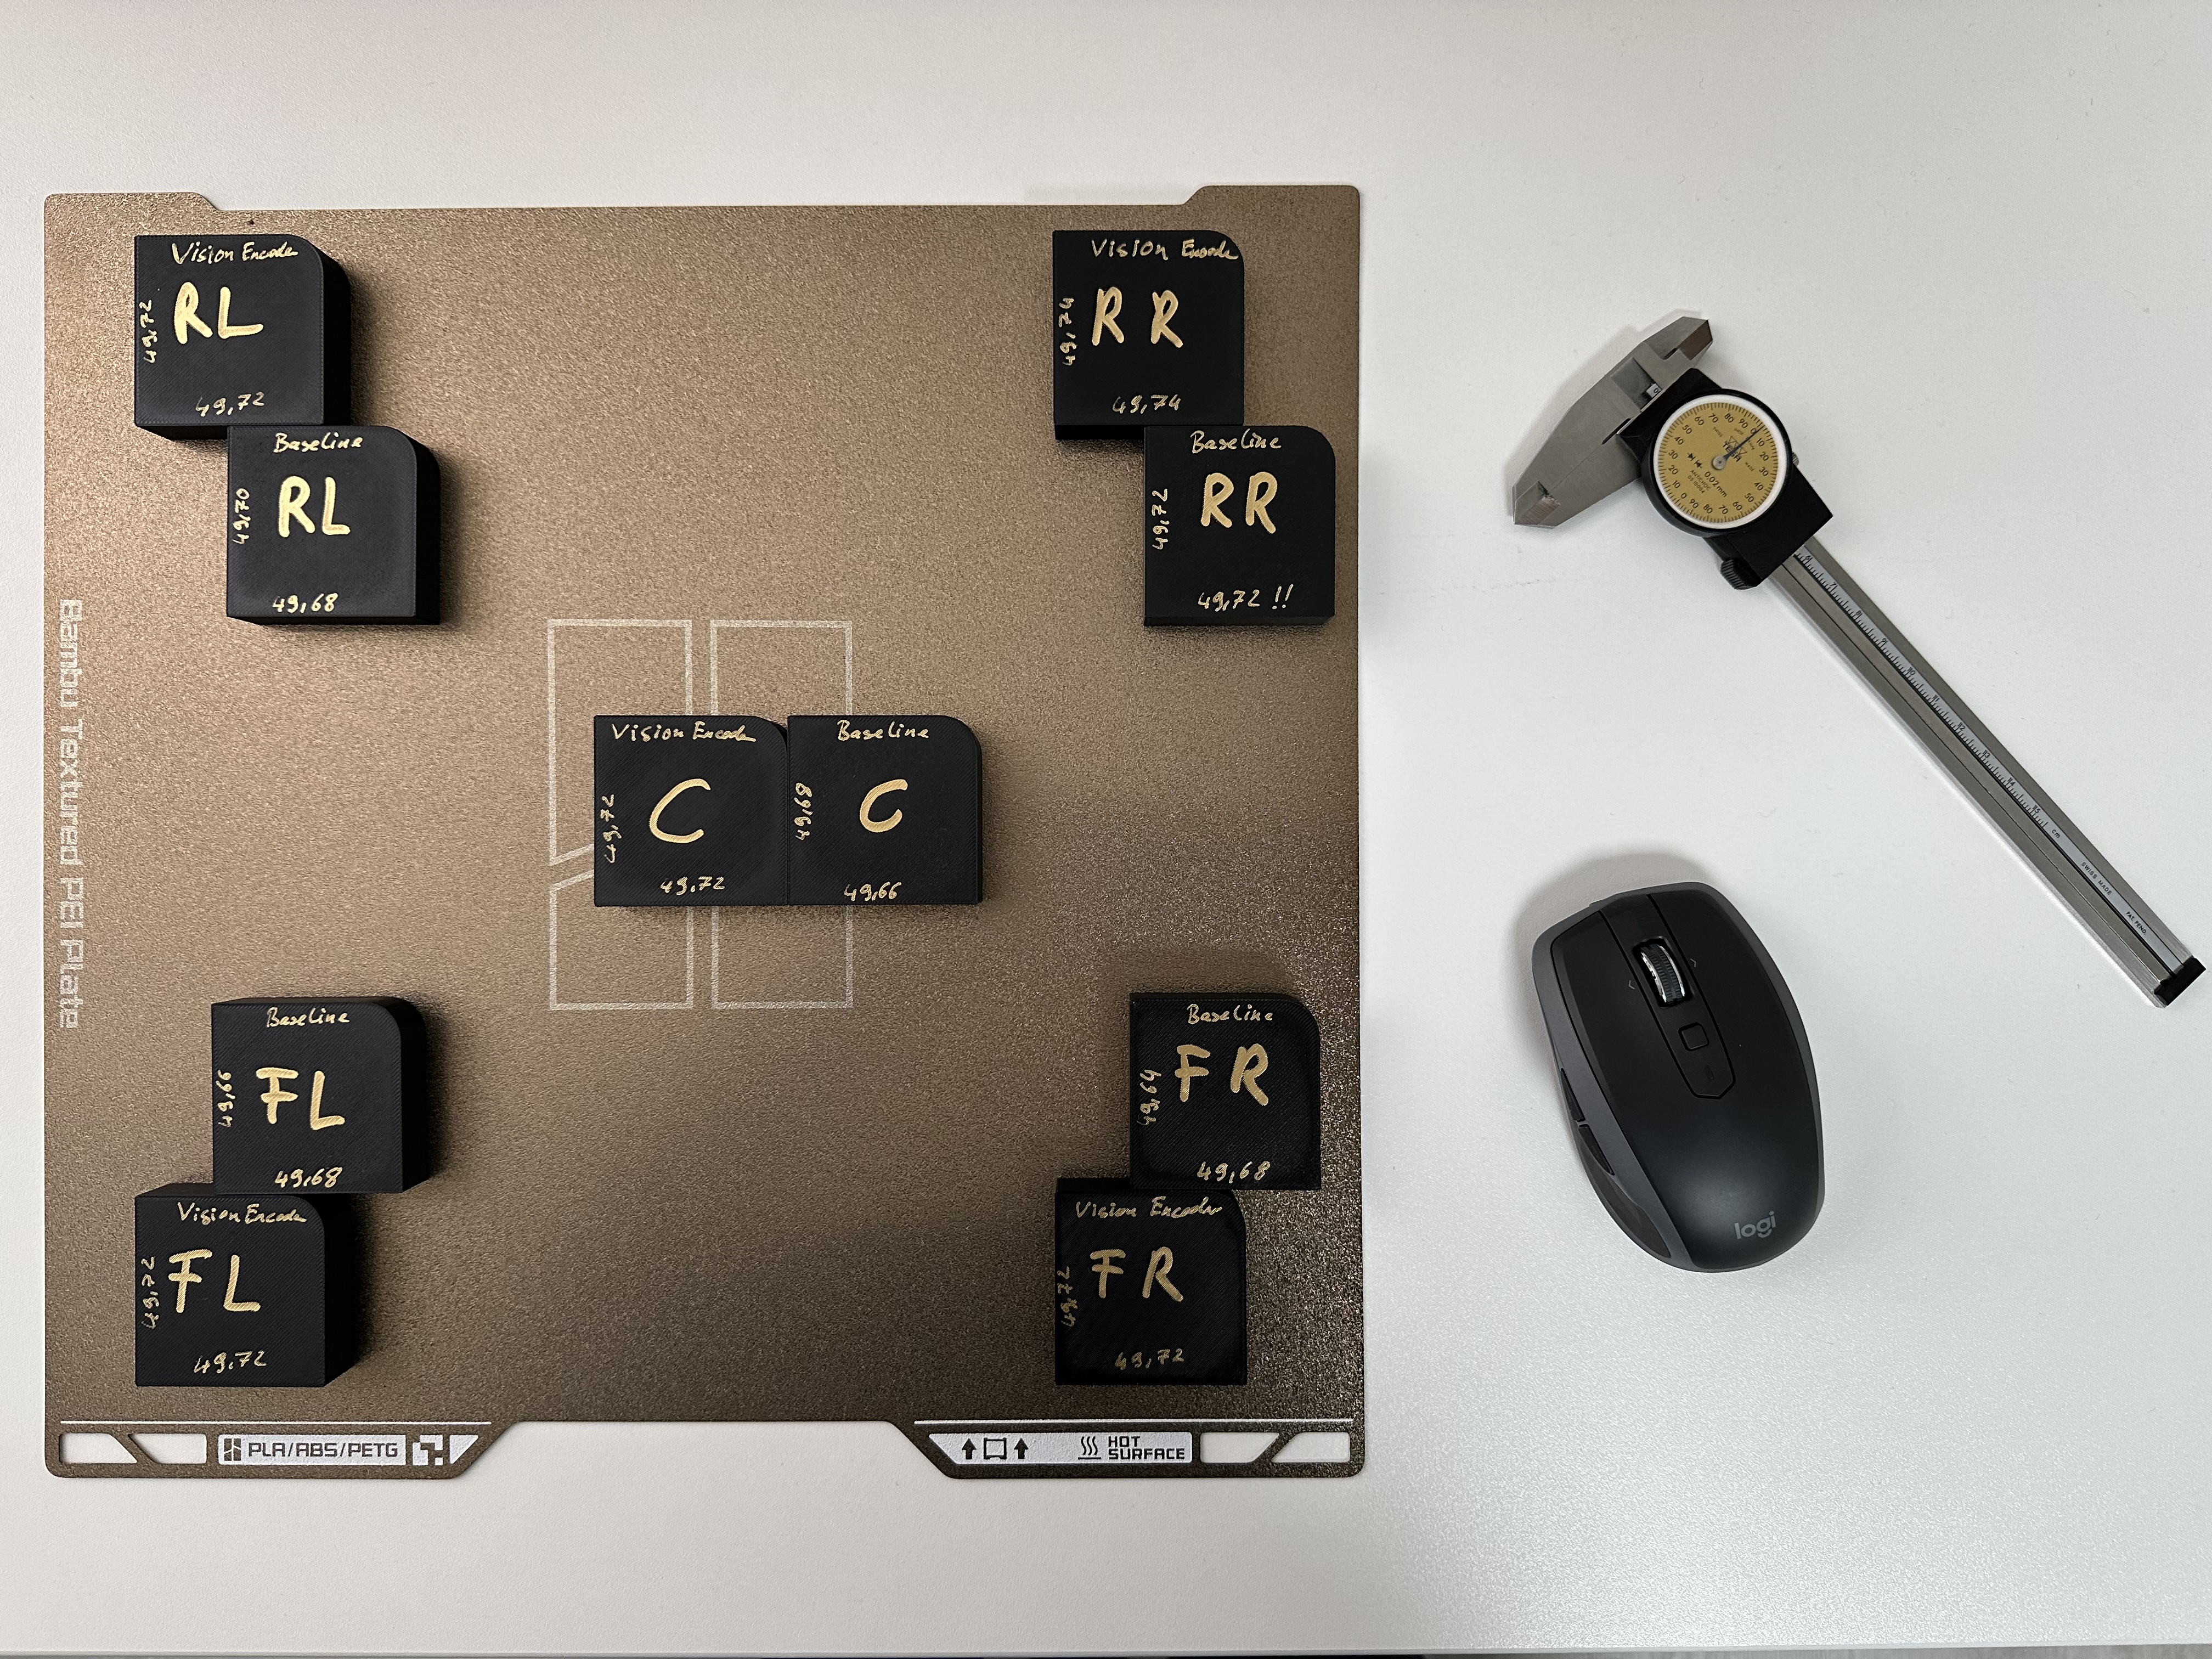
From a neutral perspective, this indicates that the Vision Encoder effectively reduces positional deviation and improves repeatability across the build plate. The average measurement of 49.724 mm corresponds to a shrinkage of 0.276 mm, or approximately 0.55%—slightly lower than the initial 0.64% baseline. While the printed parts remain a bit under the nominal 50 mm target (which is completely normal for PETG due to material shrinkage), the results are now far more uniform. Overall, the calibration delivers a cleaner, more stable, and more reliable dimensional baseline for any future tests.
A Quick Note on Perceived Shrinkage (Actual vs. Perceived Shrinkage)
The Vision Encoder and its calibration cannot influence material shrinkage, because shrinkage is caused by the physical behavior of the filament as it cools down — not by the motion accuracy of the printer.
Material shrinkage depends on:
- the chemical composition of the filament (PETG in this case),
- extrusion temperature,
- cooling behavior,
- layer height,
- ambient temperature,
- infill and wall thickness,
- and the thermal contraction during cooling.
None of these factors change when you add the Vision Encoder.
The Vision Encoder only affects how precisely the print head follows the intended X/Y path. It corrects motion deviations, backlash, small nonlinearities, and positional drift across the build plate.
So while the Vision Encoder can improve dimensional consistency and accuracy of the printer’s movements, it cannot reduce or increase the inherent shrinkage of PETG.
The reason the calculated shrinkage percentages differ (0.64% before vs. 0.55% after) is simply because we express them relative to the intended 50 mm dimension. Since the measured averages changed slightly between the two tests, the percentage value changes as well — but this does not mean the material suddenly shrank differently. It only reflects the difference in the printed dimensions, not a change in the filament’s physical shrinkage behavior.
In other words:
- Shrinkage comes from physics.
- Consistency comes from mechanics.
The results reflect exactly that:
- Shrinkage is still present (normal for PETG) - but measured relative to the intended 50 mm.
- But the variation between prints dropped massively, because the motion system is now more repeatable and accurate.
Design by De Ka on MakerWorld (license: BY).